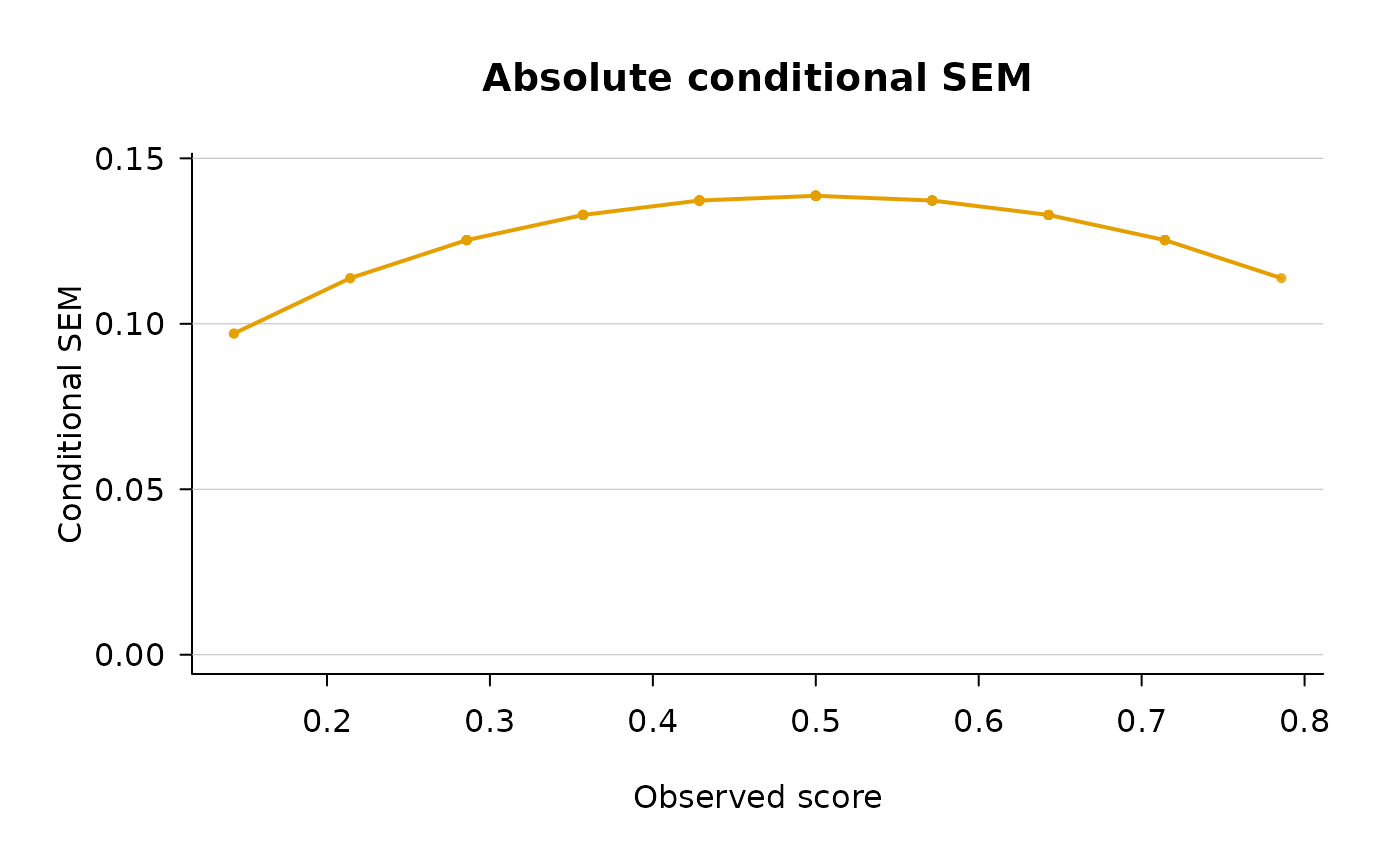
Draws a Brennan-style plot of the per-person conditional standard error of measurement against the observed score, in base graphics, following the layout of the `gtcsem_plot` Stata command. The per-person scatter is drawn from the `$estimates` table – one point per person, so that the within-score spread of the CSEM is visible – and the optional quadratic-smoother curve from the `$by_score` table.
Usage
# S3 method for class 'csem'
plot(
  x,
  plot_type = c("csem", "ci", "both"),
  error_types = NULL,
  method = NULL,
  show_smooth = TRUE,
  compare_methods = FALSE,
  compare_points = FALSE,
  cibands = c("person", "model"),
  asemethod = c("analytical", "bootstrap"),
  ci_level = NULL,
  theme = c("csem"),
  col = NULL,
  pch = 16,
  cex = NULL,
  lwd = 2,
  lty = 1,
  alpha = NULL,
  main = NULL,
  sub = NULL,
  xlab = NULL,
  ylab = NULL,
  ylim = NULL,
  xlim = NULL,
  add = FALSE,
  ...
)
Arguments
- x
A `csem` object.
- plot_type
One of `"csem"` (the per-person scatter, the default), `"ci"` (confidence bands only), or `"both"`. Not used by the compare layout.
- error_types
Character vector selecting the error type(s) to plot: `"absolute"`, `"relative"`, or both. Two error types are drawn as a side-by-side pair of panels. Defaults to the error types carried by `x`.
- method
Relative-error estimator to plot when `error_types` includes `"relative"`: `"full"`, `"large_a"`, or `"uncorrelated"`. Defaults to the first method carried by `x`.
- show_smooth
Logical; overlay the quadratic-smoother curve when it is available. Defaults to `TRUE`.
- compare_methods
Logical; overlay the three relative-error estimators on one panel with a legend. Defaults to `FALSE`.
- compare_points
Logical; in the compare layout (`compare_methods = TRUE`), also draw the per-person scatter for each estimator. Defaults to `FALSE`, which overlays the smoother curves alone.
- cibands
Source of the confidence bands when `plot_type` is `"ci"` or `"both"`: `"person"` (per-person intervals collapsed to the score level) or `"model"` (a band around the quadratic fit).
- asemethod
Sampling-variance source for the `"person"` bands: `"analytical"` or `"bootstrap"`. Ignored when `cibands = "model"`.
- ci_level
Confidence level for the bands. Defaults to the level stored in `x`.
- theme
Plot theme. csemGT ships a single own theme, `"csem"`.
- col
Override colour for the plotted series. `NULL` uses the theme palette. Not applied in the compare layout.
- pch, cex, lwd, lty
Graphical parameters for the scatter points (`pch`, `cex`) and the smoother curve (`lwd`, `lty`).
- alpha
Point transparency in `[0, 1]`. `NULL` calibrates it to the number of plotted persons.
- main, sub, xlab, ylab
Title, subtitle and axis labels. `NULL` selects a sensible default; for `plot_type` `"ci"` / `"both"` the default subtitle reports the confidence level and band source. In the side-by-side layout `main` is not applied (each panel keeps its own title).
- ylim, xlim
Axis limits. `NULL` selects a sensible default; the side-by-side and compare layouts share one `ylim` across series.
- add
Logical; if `TRUE`, draw onto the current plot instead of opening a new one. Not supported with the side-by-side or compare layouts.
- ...
Additional graphical parameters passed to the underlying `plot()` call.
Details
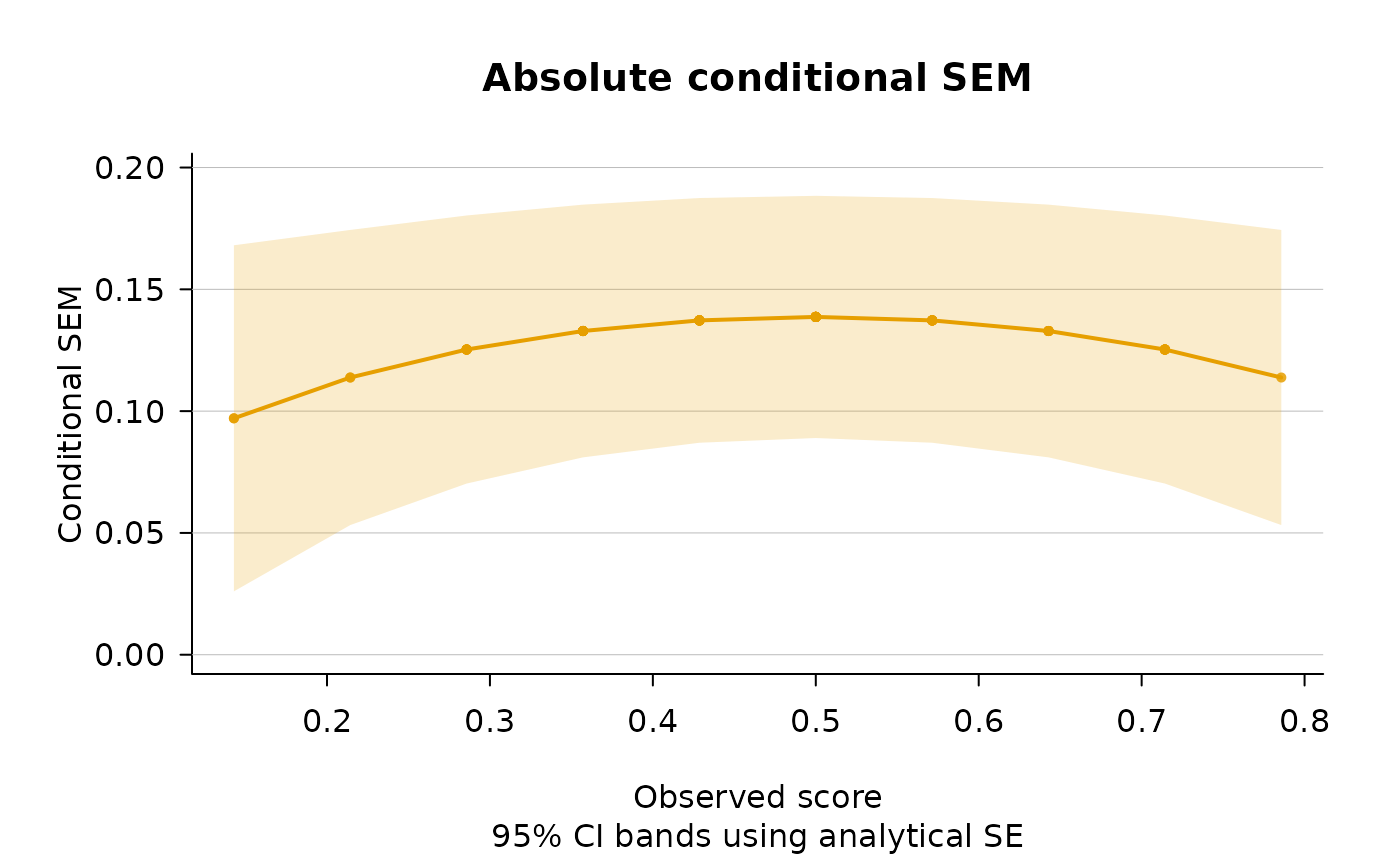
When `plot_type` is `"ci"` or `"both"` a confidence-band ribbon is added. Two band sources are available through `cibands`:
* `"person"` (the default) draws \(\widehat{csem} \pm z\, \widehat{se}\) around the by-score CSEM curve, using the per-person sampling SE of the CSEM. `asemethod` selects whether that SE is the analytical or the bootstrap one; the bootstrap SE is only available when `csem_gt()` was run with `bootstrap = TRUE`. * `"model"` draws a band around the quadratic smoother. The per-person error variance is refit on the observed score and its square, and the SE of the mean fit is converted to the CSEM scale by the delta method. `asemethod` is ignored for this source.
The confidence level is `ci_level` (defaulting to the level stored in `x`), so a level different from the one used at fitting time can be requested at plot time. The lower edge of every band is truncated at zero.
When two error types are requested (`error_types = c("absolute", "relative")`) the two are drawn as a pair of panels sharing one y-axis, so the absolute and relative CSEMs are read on a common scale. Each panel keeps its own title; a user-supplied `main` is not applied in this layout, and `add = TRUE` is not supported.
When `compare_methods = TRUE` the three relative-error estimators are overlaid on one panel with a legend, to compare their smoother curves directly. The per-person scatter is omitted by default – three clouds would not be legible – and added for every estimator by `compare_points = TRUE`. Confidence bands are not available in this layout, `add = TRUE` is not supported, and `col` is not applied (each estimator keeps its palette colour).